Building interactive dashboards and reports using the infinitii flowworks API and Power BI
Creating interactive visualizations from time-series data and running “what-if” analysis on trends is a recurring theme in collaboration-driven utilities. Here is the six-step version.
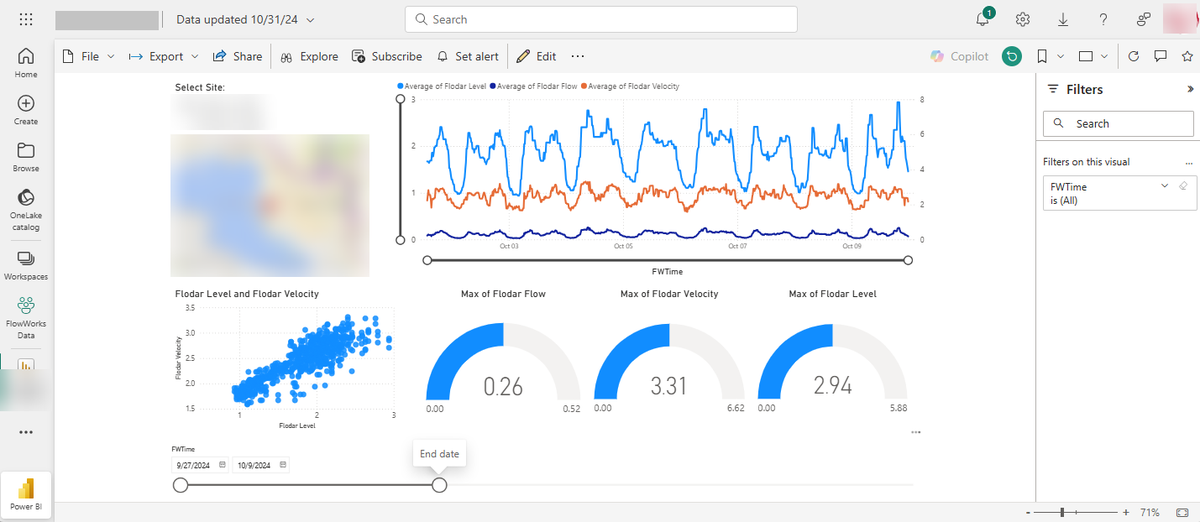
The ability to create interactive dashboard visualizations from time-series infinitii flowworks data, and to perform “what-if” analysis on trends, is a recurring theme in collaboration-driven water utilities. While Excel has long been a data-sharing staple, today's tool of choice is increasingly Microsoft Power BI.
infinitii flowworks has a convenient API that makes Power BI dashboard creation, visualization and sharing a six-step process. Creating an Excel data report is very similar.
Six steps
- Click Get data in Power BI, select Blank Query in the data source options, then click Connect to open the Power Query Editor.
- In the Power Query Editor choose Advanced Editor and check the Ignore Privacy Levels dialogue box. A username and password must be entered into the Advanced Editor dialogue box — use a infinitii flowworks account with the appropriate privileges to access the target data.
- Enter the connection script for the desired infinitii flowworks data in the Advanced Editor dialogue box, then click Done.
- You will now see the returned records from your infinitii flowworks API query in the Power Query Editor. From here you can transform the data into a table, pivot by column, format data types, add columns and filter.
- When you are satisfied with the format and layout, click Close & Apply.
- Build your Power BI dashboard, then share it with colleagues.
On account privileges: the API reads whatever the account you authenticate with is entitled to see. Scope that account to the sites the dashboard is meant to cover rather than reusing an administrator login.
If you would rather we built it, our professional services team constructs Power BI dashboards against your own data.
First published on the infinitii ai blog. infinitii ai is the company behind infinitii flowworks.
Related
See it on your own data
A walkthrough on your own sites answers the questions an article cannot.