RDII calculations using machine learning with Auto I&I
Identifying where an inflow and infiltration problem is, and how big it is, gives utilities and their stakeholders what they need to make decisions on infrastructure investment.
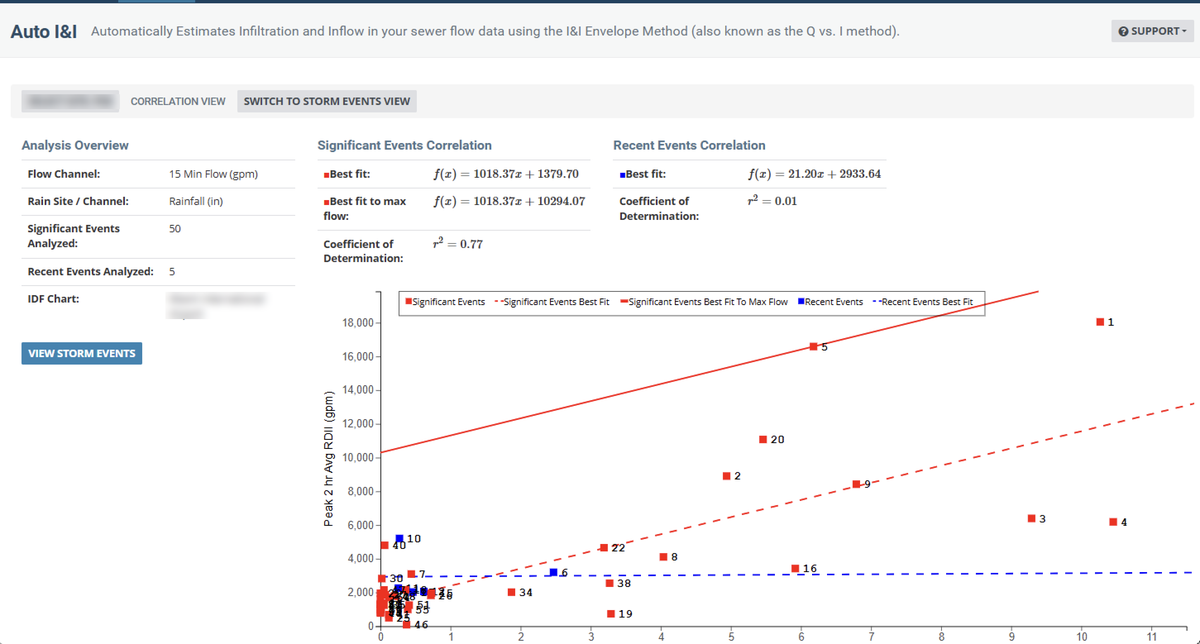
Rainfall derived infiltration and inflow (RDII) of extraneous stormwater and groundwater into sanitary sewers can unduly affect the capacity and operation of collection and treatment systems. Identifying where a problem is and how big it is gives utilities and their stakeholders the understanding they need to make decisions on required infrastructure investments.
That creates a need for sound and defensible RDII estimation methods to support infiltration and inflow reduction and remediation programs. Applying machine learning to system flow and rainfall data leads to accurate forecasting of I&I impacts on collection system capacity and treatment plant capacity, and makes storm events easy to compare.
What it changes
- Proactive I&I management. Prioritize system repairs and rehabilitation, and design infrastructure to better accommodate future growth, rather than reacting.
- Automated daily updates. Daily updates on collection system I&I issues, instead of waiting on seasonal, annual or multi-year manually compiled engineering reports.
- Visual representation of RDII. View all catchment areas in a GIS view with metrics colour-coded against predetermined thresholds.
- Mitigation planning. Timely delivery of analysis results gives municipalities more time to plan mitigation.
- Environmental benefit. Increased system resiliency and adaptation to climate change.
- Compliance reporting. Because all storm events are covered and the data is delivered immediately after each event, Auto I&I can assist with RDII reporting requirements where they apply.
How the analysis works
Auto I&I uses the envelope method for calculating RDII. Each site that collects data can be explored by storm event, showing hydrographs that include rainfall, flow and derived RDII volume. Non-technical users can immediately see the locations where problems are occurring — which means the collection system team can show other municipal stakeholders exactly what RDII is and how it affects the system.
According to the Water Environment Federation, RDII models require appropriate inputs and intricate computational algorithms to achieve their analysis objectives, and RDII quantification can be improved by collecting flow and rainfall monitoring data and observing system performance during various meteorological conditions.
With Auto I&I you can see changes to your collection system over a long period to determine the overall impact of a storm event. Since no two storm events are the same, you can click through different dates to compare them in a highly visual format.
Using incoming data, Auto I&I colour-codes basins or catchment areas by key metrics so users can spot problems in the network. Key metrics can be customized per deployment to show what matters most for that area — RDII by catchment area (gal/acre), RDII volume by pipe length (gal/lf), RDII by pipe area (gpm/in-mile) and so on. The application's machine learning continually creates and updates dry weather patterns as data arrives.
In the correlation view, users can look at the relationship between rainfall and peak RDII for each event. Auto I&I separates significant storms from minor events and provides the correlation equation for each.
Talk to us about adding Auto I&I to your infinitii flowworks subscription.
First published on the infinitii ai blog. infinitii ai is the company behind infinitii flowworks.
Related
See it on your own data
A walkthrough on your own sites answers the questions an article cannot.