Overflow risk mitigation and regulatory compliance
Wet-weather overflow management demands real-time visibility, fast response and defensible documentation. Doing all three at once, with existing staff and existing data, has historically been out of reach.
During a major storm event, every minute without actionable information is a minute your operations team is working blind. Overflow events in sanitary sewer networks carry serious consequences — regulatory exposure, environmental harm and costly post-event investigations — yet most utilities still rely on fragmented, after-the-fact reporting to understand what actually happened in their collection system.
What your operations team gains
A live map of the whole network
Colour-coded site markers show where overflow conditions are active, elevated or recently resolved, system-wide and at a glance.
Consistent, configurable real-time alerting
Threshold logic applied uniformly across all overflow sites — green, yellow, orange, red — so the team always knows severity and status without interpretation.
Automated PDF and CSV event reports
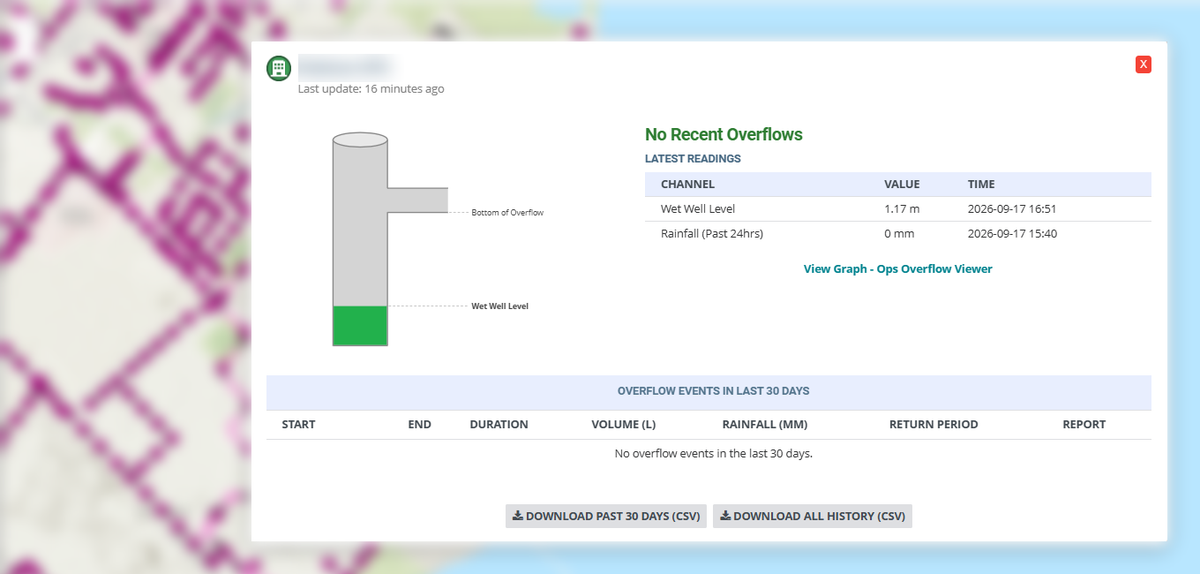
Each overflow event generates a ready-to-submit report with duration, volume, rainfall and return period, which removes the manual compilation after every wet-weather event.
Auditable event histories
A rolling 30-day table of events per site, plus full historical downloads. Every event timestamped, documented and available the moment regulators ask for it.
Rainfall return period classification
Each event is automatically contextualised against IDF data, so staff and regulators can tell whether it was routine rain or a genuine design storm.
A foundation for real-time control
Built on data you already collect — no new sensors required. When you are ready to move toward real-time control and predictive decision support, the platform goes with you.
How it works
The system publishes directly into your infinitii flowworks Apps page, making it available to the operators and administrators you designate — no separate login and no second platform to manage. An interactive map displays your overflow sites and flow monitoring network with live status overlays. Selecting any site opens a drilldown view with current readings, pipe fill graphics, threshold indicators and the complete overflow event table for that location. Each site detail view includes live readings for depth, velocity, flow and 24-hour rainfall.
As an integrated module it works directly with the data you are already collecting — raw and final channels, rain gauges and GIS asset layers alike — with no new data infrastructure.
Built for regulatory reporting
When a regulator asks for overflow documentation, your team should not be scrambling. The system produces structured, audit-ready records automatically for every event, with no manual steps between the event and the report. Event PDFs can be downloaded in bulk for a selected month, year or common range, packaged as a single ZIP and clearly named by site and event date.
Worth knowing: this is one of the applications deployed with specific customers rather than a standard part of every subscription. Most infinitii flowworks deployments involve some customisation — ask us what it would take for your network.
First published on the infinitii ai blog. infinitii ai is the company behind infinitii flowworks.
Related
Rainfall
IDF analysis and return periods — the context each overflow event is classified against.
See it on your own data
A walkthrough on your own sites answers the questions an article cannot.