Creating Graphs has never been easier


Visualize your data in an interactive, easy to use graphing tool. Plugin-free and works on phones and tablets. Boasts advanced curve fitting functions and a powerful data viewer.

Start your FREE Trial

What can you do with Data Graphing?

Interactive Graphing

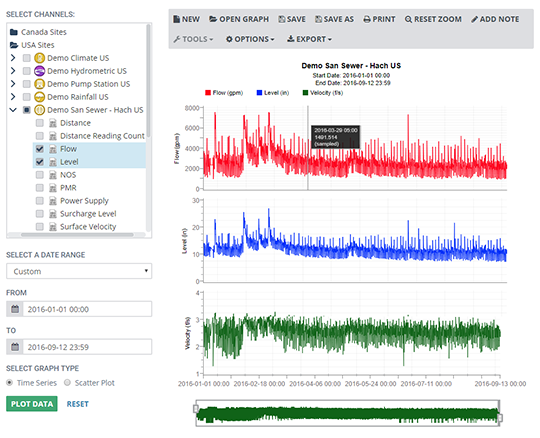
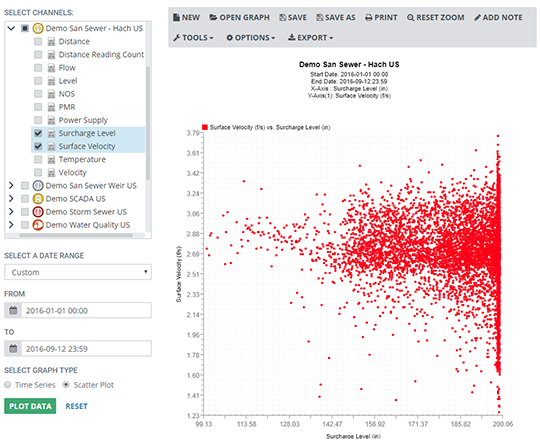
FlowWorks Graphing enables you to visually display data from virtually any channel in the format of either a time-series or scatter plot graph. Works in any modern web browser on any device with any screen size and resolution without the need to install any software. Freely explore your data with easy to use zoom features, and navigate through massive volumes of data efficiently.

FlowWorks Graphing

Customizable Layouts

Have complete control of the look and feel of your graph. Customize the colors, line types, and plot types. Choose how you want to visualize your data by controlling the number of axes, the labels, and how they are displayed. Quickly save your graphs for easy reference, and share them with other users.

FlowWorks Graphing

Data Viewer and Export

Integrated with your graph is a detailed table view of your plotted data. Click any point on your graph to automatically view the corresponding data. Quickly download your graphed data to a CSV file for offline review.

FlowWorks Graphing

Scatter Plots

Scatter Plots allow you to view relationships and correlations between two or more channels of data. A variety of curve fitting functions are available and can be used to visualize trends. Manning equations can be added to your plot to represent the relationship between depth and velocity.

FlowWorks Graphing