Connect everything. See it now. Make it yours.
All your monitoring data in one place, live, and shaped to the way your organization works. Loggers, SCADA systems and sensors from any manufacturer connect to flowworks just as they are.
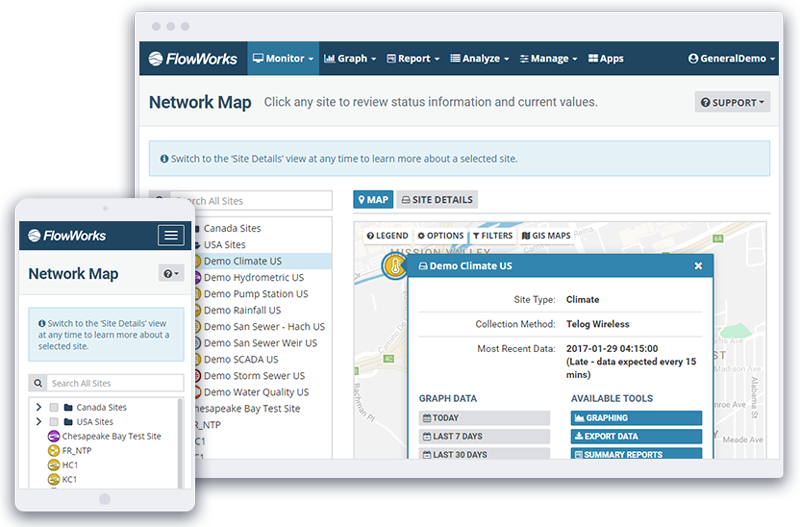
Less time gathering data. More time using it.
Most organizations already collect more data than they use. It sits in a manufacturer's portal, a logger file, a SCADA historian, or a spreadsheet on someone's desktop. Before anyone can answer a question, that data has to be found, exported, lined up by timestamp and stitched together. On most projects, that takes longer than the analysis itself.
Then the next question starts the whole process over. With flowworks, the gathering is done once, and it keeps running. Every source lands in one place, aligned and current, so engineers and operators spend their time on answers instead of assembly.
Connect everything
Whatever you own now, and whatever you buy next. Sensors and loggers from any manufacturer, SCADA systems, and outside sources pulled in automatically over web APIs. You're never locked to one vendor, and new sources are added continuously.
Consolidate several systems into one without replacing a single instrument.
- Sensors and loggers from any manufacturer
- SCADA integration
- Automatic web API ingestion, including third-party gauge-adjusted radar rainfall
- Bulk historical import, with no limit on how far back the record goes
See it now
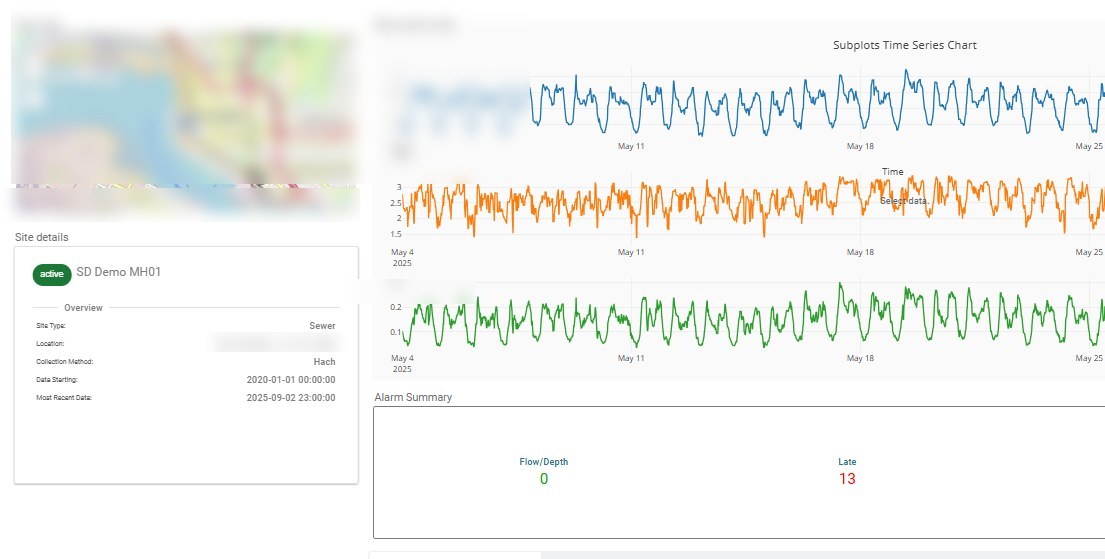
Your data as it arrives, not in a log file you download later. Once everything is in one place, you see it live. Every site sits on a map with its current value and alarm state. Time series are graphed across sites as new readings land, and saved templates keep the views you use every day one click away.
Alarms work on any channel, measured or calculated, and go out by web, email, SMS or voice. Dwell times keep a passing spike from triggering a notification, and schedules and acknowledgment are built in.
Know about a problem while you can still do something about it.
- Live network map with alarm state by color
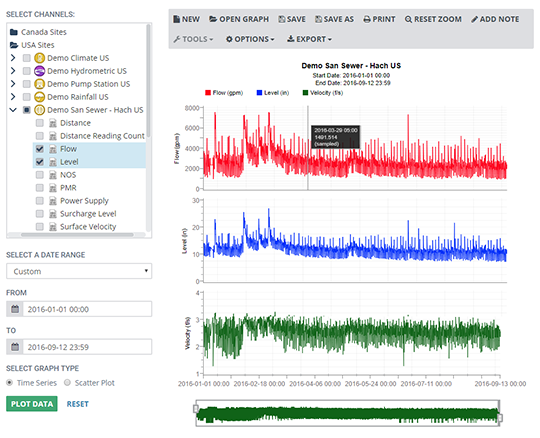
- Multi-site graphing, scatter plots and curve fitting
- Alarms by web, email, SMS and voice, with schedules, dwell times and acknowledgment
- Mobile access for field staff
Make it yours
Build the calculations your organization needs. See them anywhere. Share them with anyone. Every organization has questions no off-the-shelf tool anticipated, shaped by its geography, the age of its infrastructure, or what its regulator requires. Most monitoring applications limit what you can do with your data and where you can take it. We built flowworks the other way.
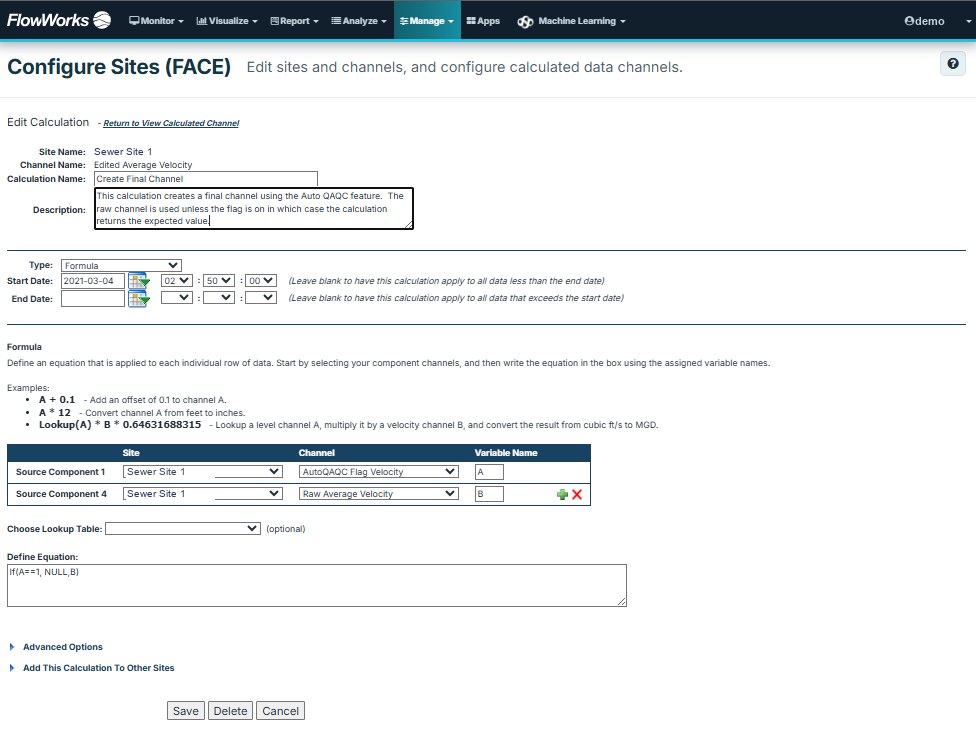
Build a calculated channel in FACE from formulas, functions and IF/THEN/ELSE logic, with no programming. When you need more, FACE Pro runs your own Python or R. Either way, the calculation runs continuously against live data, whether it's a unit conversion, a forecast or a pattern-recognition model, and the result behaves like any sensor: you can graph it, alarm on it and report on it.
Put it on a custom dashboard built for whoever needs to see it, whether that's a supervisor, a council or a named group. Send it anywhere through the API, calculated channels included. Several cities use this to publish combined sewer overflow (CSO) warnings to residents on their own websites.
A platform that grows with your organization, not one you'll outgrow.
- FACE — no-code calculated channels from formulas, functions and conditional logic
- FACE Pro — Python and R, with NumPy, pandas and scikit-learn
- Predictive channels and pattern recognition, running on live data
- Drag-and-drop custom dashboards, shared by group
- An API that sends measured and calculated channels out and brings data back in
- Storm Water Management Model (SWMM) and EPANET models run against live data
- Build once, and it runs on all future data
One system for the whole organization
Operations
A live map, alarms on any channel, and mobile access in the field.
Engineering and planning
Inflow and infiltration (I&I), rainfall and capacity analysis, calculated channels, and hydraulic models on live data.
Management and the public
Dashboards, scheduled reports, and public notifications published straight from the record.
It runs in a browser with nothing to install and nothing for IT to host. Role-based permissions, site-scoped contractor access, and multi-factor authentication (MFA) come standard.
Start from the problem
Select a focus area to see how flowworks is deployed for that kind of work.
Wastewater & I&I
Capacity monitoring, inflow and infiltration analysis, improvement planning and daily operations.
Water
Distribution pressure, pressure reducing valve (PRV) performance, reservoir levels and water quality.
Rainfall
Intensity-duration-frequency (IDF) curves, return periods, storm statistics and third-party radar rainfall.
Facilities
Pump stations, treatment plants and PRV stations, including run hours, duty balance and compliance.
Streamflow
Hydrometric networks, stage–discharge ratings and flood stage alarming.
All solutions
Browse every focus area.
Bidding, specifying or supplying?
infinitii flowworks subscriptions often start with an RFP or RFQ, and most of those bundle instrumentation, installation and software into one package. If you're the engineering firm or equipment supplier assembling that bid, flowworks answers the software half, and we'll help you write that part of the response.
The subscription can sit wherever it works best: with the utility, or with the engineering partner handling administration during the project. Either way, the utility's data stays the utility's, and the subscription can transfer to them when the project ends.
- Engineering firms — deliver analysis as a live channel, not a report
- Equipment manufacturers — give customers more from your devices' data
- RFP software requirements — a point-by-point reference for bid writers
Start with your own data
A demo runs on your sites and your history, not a sample dataset. Bring a question you haven't been able to answer easily.