Streamflow monitoring and discharge prediction
Monitoring and predicting discharge — whether you look after one creek or run a full hydrometric network.
More data, better discharge predictions
Measured discharge comes from your own level sensors and a rating curve. Predicting it gets better with every input you add. Precipitation, temperature, solar radiation, soil moisture and snowpack are what an engineer uses to estimate evapotranspiration, snow melt and everything else that decides how much water reaches the channel — and they come from different agencies, on different instruments, in different formats.
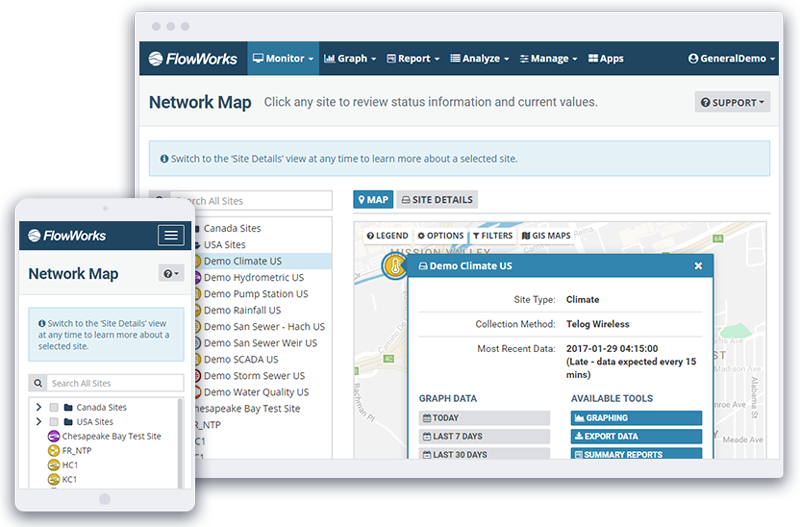
Your level sensors and loggers connect as they are, regardless of the manufacturer. Public data from the USGS, Environment Canada, NOAA and NASA comes in automatically over web API as ordinary sites and channels, so an upstream public gauge sits beside your own record rather than in a separate browser tab. Once it is all in one place, the inputs to a discharge prediction are already assembled.
- Level sensors and loggers from any manufacturer
- USGS, Environment Canada, NOAA, NASA and similar services as configured sites and channels
- Precipitation, temperature, solar radiation, soil moisture and snow on the same timeline as discharge
- Pulled automatically over web API — no manual download step
Discharge as a live channel
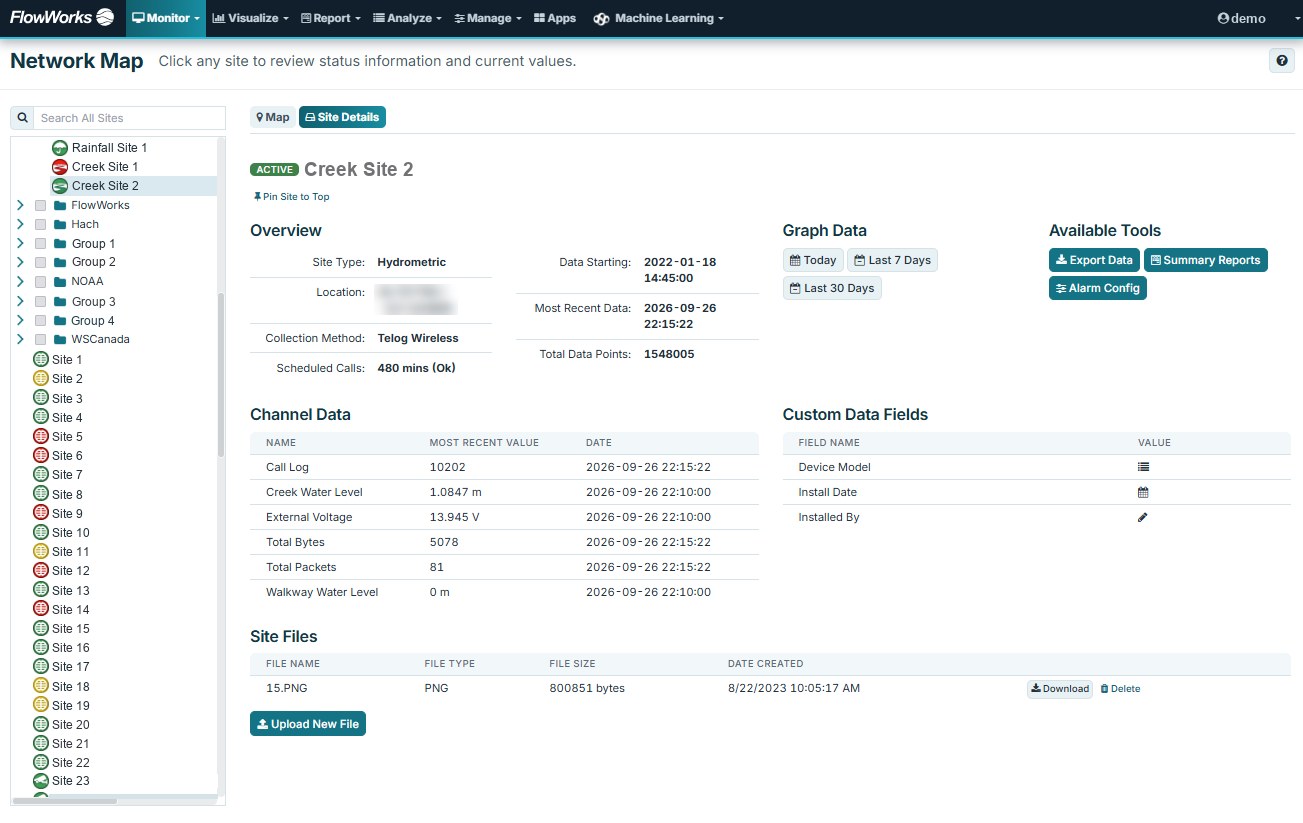
Level is measured continuously; discharge usually is not. The rating curve is developed offline, applied to the level record afterwards, and revisited when someone notices it has drifted. In flowworks, curve fitting quantifies the relationship between level and discharge, and a calculated channel applies it to live level readings, so discharge is current at every site. When the rating is revised, the derived channel follows.
Because level is a live channel, you can set alarms on it directly, with notifications by web, email, SMS or voice.
- Level–discharge rating applied to live level readings
- Alarms and notifications on level
- Metadata storage for verification measurements and field observations
The packaged rating tool was originally built for a particular customer, which is how a good deal of flowworks gets built. If the rating behaviour you need is not quite the one described here, it is worth asking.
Predicting discharge, continuously
Once the inputs are in one place, the calculations that turn them into a discharge prediction can run there too. FACE builds the simpler derived channels without programming — rolling precipitation totals, averages across a catchment’s gauges. FACE Pro runs your own Python or R for the rest: evapotranspiration from solar radiation and temperature, snow melt, and soil moisture from contributing sources.
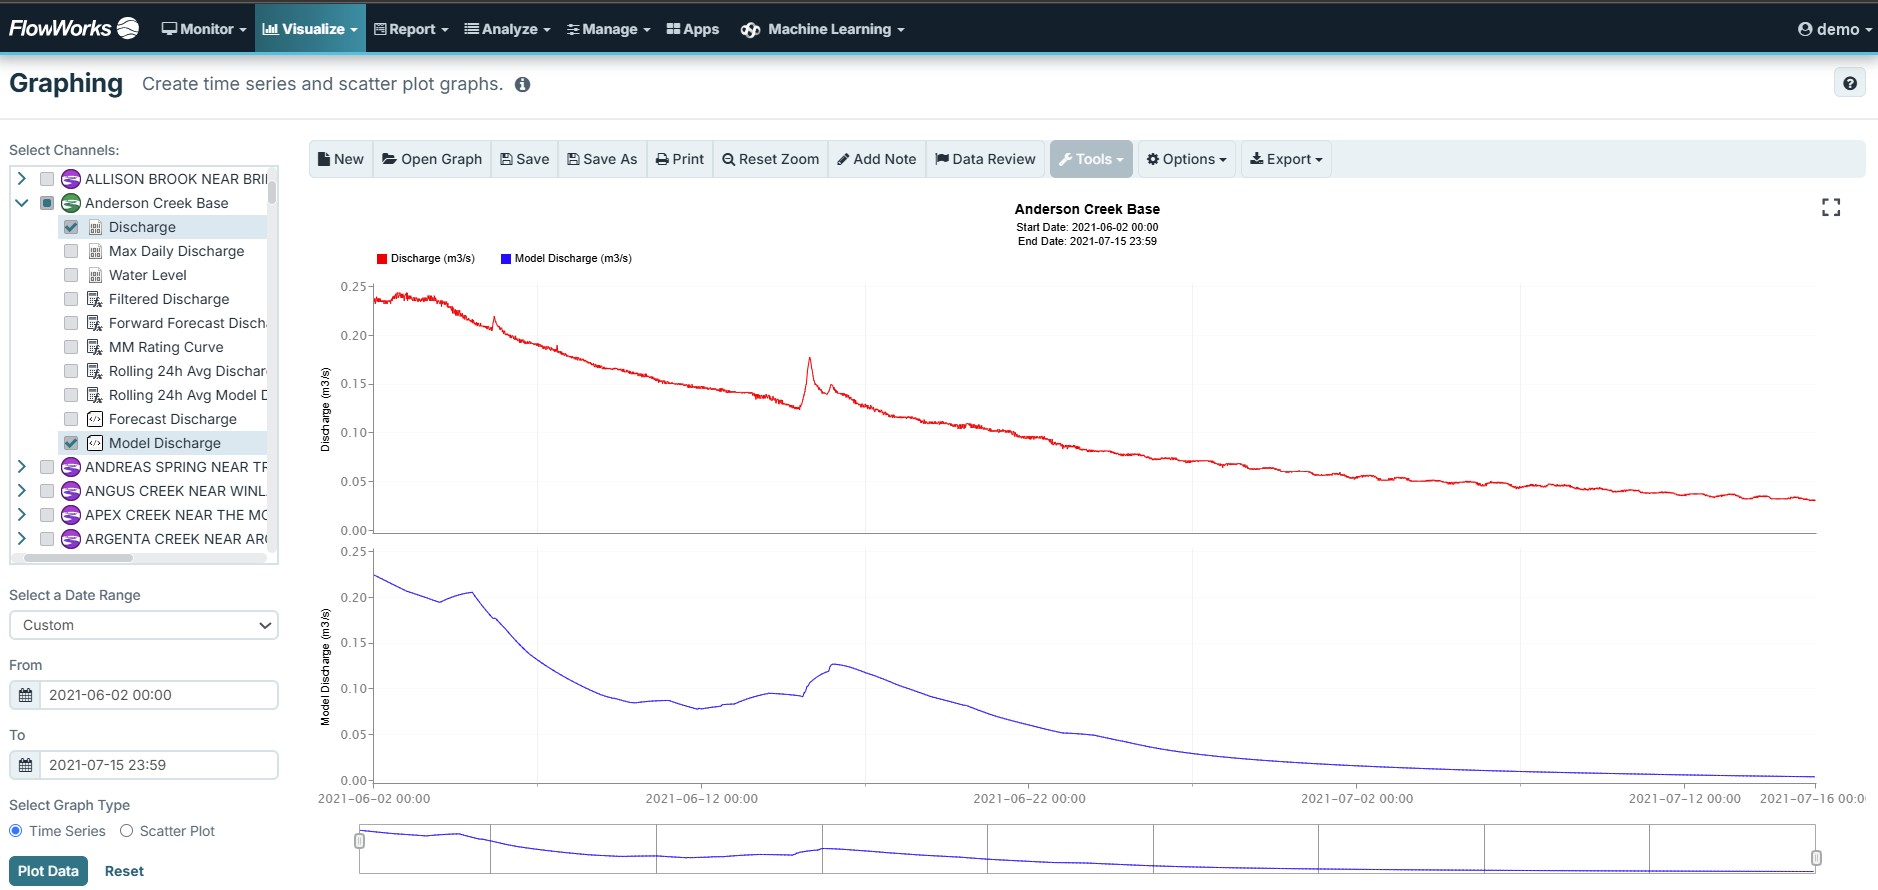
Those channels drive the hydrological model, and streamflow is where model integration started for us. On Anderson Creek, RAVEN — a hydrological modelling framework — predicts discharge from rainfall, temperature and soil moisture drawn from NASA, Environment Canada and physical sensors on the ground. The work was carried out under the Fresh Water Data Commons project, part of Canada’s Digital Supercluster, alongside partners including Microsoft, Teck Resources and the University of Victoria. The graph shows the result: modelled discharge against what was measured on Anderson Creek, June to July 2021.
The point is that it does not stop. Rather than a model built during a study and validated once, the simulation runs continuously against live incoming data, and third-party weather model data brings the forecast in — so the same machinery that reproduces yesterday can project tomorrow. The API then carries measured and predicted discharge out again, to another system or a public website.
- Evapotranspiration, snow melt and soil moisture derived as calculated channels
- RAVEN hydrological simulation running continuously against live data
- Third-party weather model data as a forecast input
- Modelled and forecast discharge returned as channels, beside the measured record
Lead time, on a screen built for the people using it
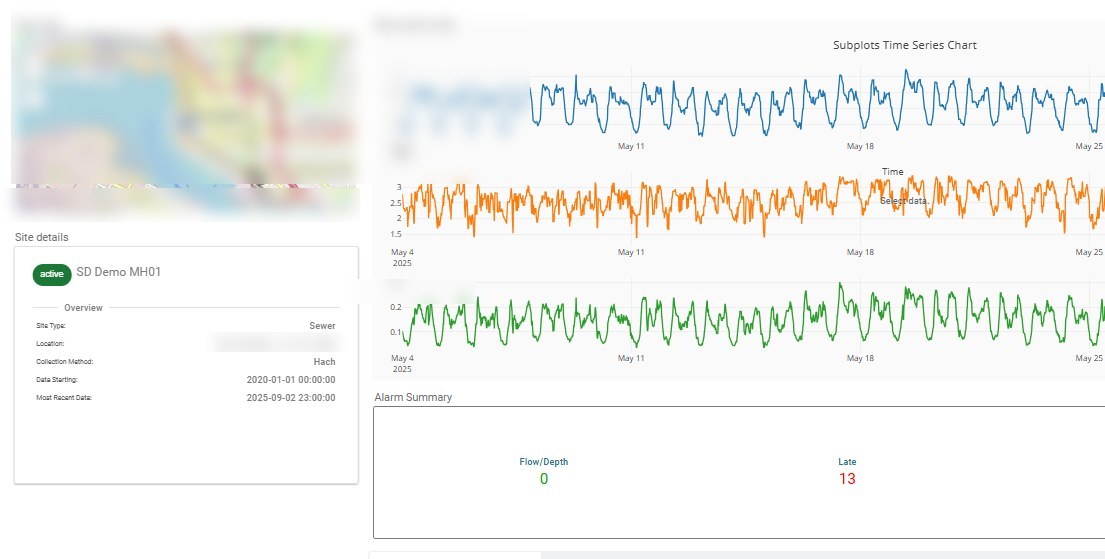
Flood forecasting runs as an application inside flowworks, with the results delivered through a custom dashboard built around how the responding team actually works — rather than as a model output somebody has to interpret. The same builder covers the quieter days too: a programme dashboard showing which gauges are reporting, which have gone quiet and how the network is behaving overall.
That distinction matters during an event. The people who need the forecast are rarely the people who built it, and a prediction nobody can read in time is not lead time.
- Forecast river response, not just recorded level
- Results delivered through a dashboard designed for the responding team
- Built on the same live data, public sources and model runs described above
- Deployed per utility rather than as a standard subscription feature — ask whether it fits your system
Around the gauging network
Public data feeds
Publish live conditions to your own website through the flowworks API — useful where river levels are of public interest, and cheaper than maintaining a second system to do it.
Rainfall alongside flow
Return frequency analysis on the rainfall that produced the event, in the same place as the hydrograph it produced.
Flexible data transfer
Link directly to live data, or upload historical files — a day, a year or a decade — through the high-speed transfer service.
Who this helps, and how
Running the gauging programme
See which sites are reporting and which have gone quiet, without opening each one.
Rating and data quality
Revise a rating and have every downstream discharge value follow, with the original record preserved and the change recorded.
Share with the public
River conditions are often of public interest, and the API publishes them to your own website — so the page the public reads is fed by the same record the programme is run from.
Flood response
Alarms on level, with the recent trend attached rather than just a threshold breach.
Questions this answers
- What is the current level and discharge at every site in the network?
- How does this event compare with the largest on record at this site?
- Has the channel shifted since the last rating — and what did the site look like then?
- Which sites have stopped reporting, and when did they stop?
Try it on your own gauges
Bring a site with a rating you are not confident in. That tends to be the most useful place to start.